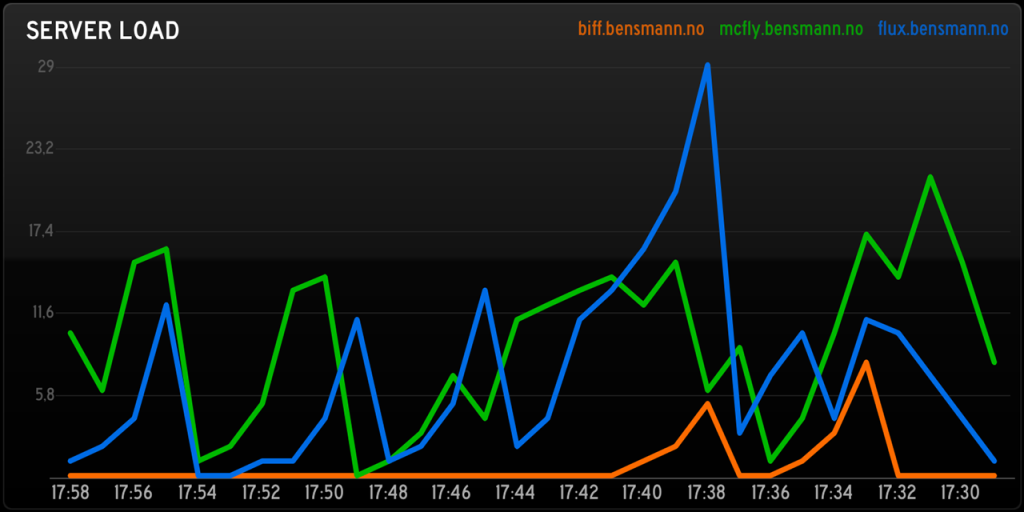
Soon after the launch of StatusBoard I published a short example of how the app could be used to display server statistics. After a lot of feedback it seems that what was of most interest to readers was what wasn’t in the post, the graph that displays historic server load …
For those who still are interested I have created a GitHub repo to share the script that allows exactly this. In short, setup and configure the script on a single server, then have all your servers call it ( using cron and curl ) in order to communicate with the script.
Here are some other posts you may like

I recently drove a Golf GTE for a day, instead of the Golf 7 i usually use for my commute. This made me think about the missed opportunities of todays hybrid. In this post I will refer to this missing feature as "Adaptive Intelligence". A learning hybrid system that optimizes…

This is hands down the question I'm asked most often, "How does the Tesla Model S handle the norwegian winters?" The short answer is great! Naturally opinions will vary, but for me it has been awesome. It has made me leave my petrol car out in the cold, literally. Preheated Lets…

Electric power companies, in general, are pretty much the same. Tibber however, is unlike any electricity company I had seen before. They try to utilise the data we get from smart devices, which they also sell, to save electricity, money and the environment, as well as improving comfort. It’s a…