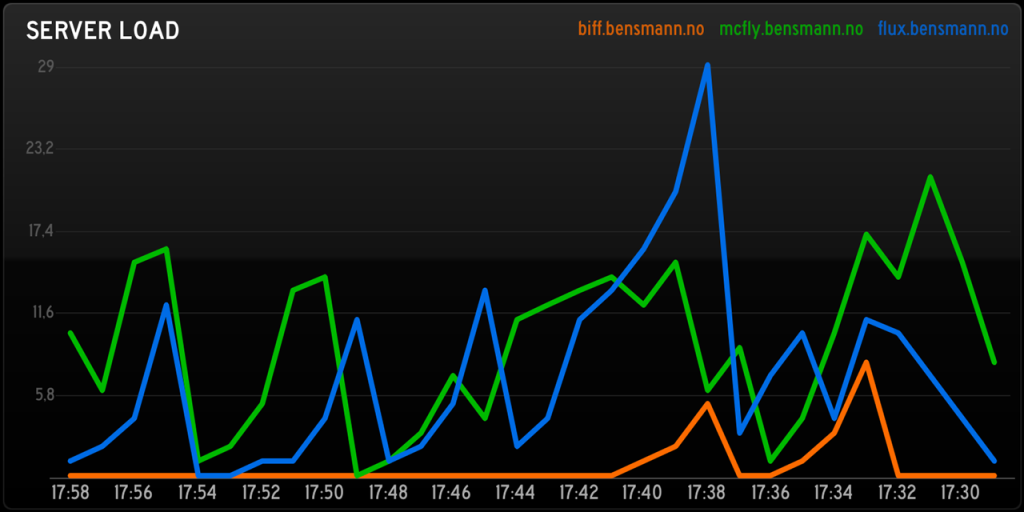
Soon after the launch of StatusBoard I published a short example of how the app could be used to display server statistics. After a lot of feedback it seems that what was of most interest to readers was what wasn’t in the post, the graph that displays historic server load …
For those who still are interested I have created a GitHub repo to share the script that allows exactly this. In short, setup and configure the script on a single server, then have all your servers call it ( using cron and curl ) in order to communicate with the script.
Here are some other posts you may like
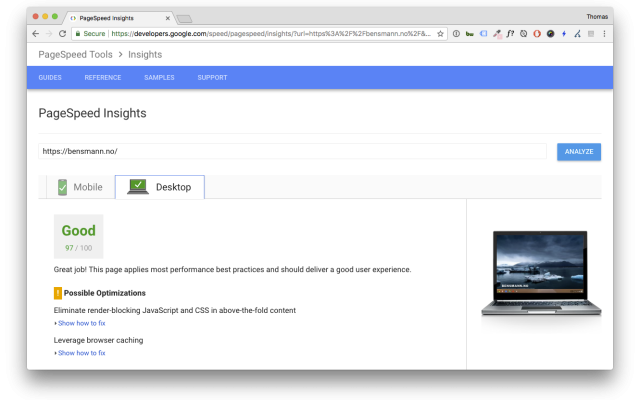
When I chose to venture back to the WordPress default theme, one of my worries was about my Google PageSpeed score. I had to take a serious hit, right? Spoiler, there is a surprise ending! Some years ago I had made it a mission to get the perfect score across…

Electric power companies, in general, are pretty much the same. Tibber however, is unlike any electricity company I had seen before. They try to utilise the data we get from smart devices, which they also sell, to save electricity, money and the environment, as well as improving comfort. It’s a…

Panic, the company behind apps such as Coda and Transmit, has released a new app called Status Board. This app is in essence a widget hub for your iPad, showcasing cool stuff such as tweets, e-mail, calendar and much more. One of the most awesome things though is the ability…