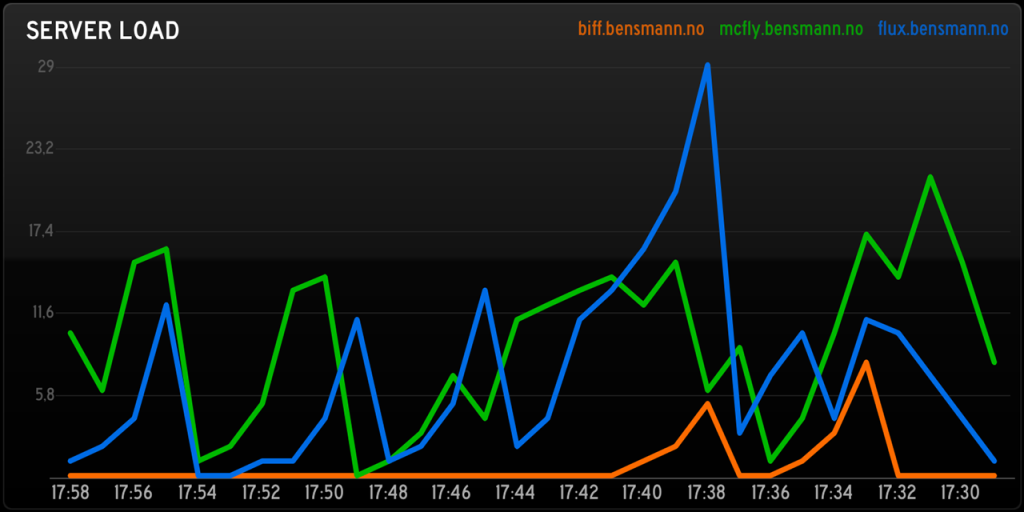
Soon after the launch of StatusBoard I published a short example of how the app could be used to display server statistics. After a lot of feedback it seems that what was of most interest to readers was what wasn’t in the post, the graph that displays historic server load …
For those who still are interested I have created a GitHub repo to share the script that allows exactly this. In short, setup and configure the script on a single server, then have all your servers call it ( using cron and curl ) in order to communicate with the script.
Here are some other posts you may like

Electric power companies, in general, are pretty much the same. Tibber however, is unlike any electricity company I had seen before. They try to utilise the data we get from smart devices, which they also sell, to save electricity, money and the environment, as well as improving comfort. It’s a…

I updated my site to utilize html5 history and ajax recently. One of the challenges I faced was how to handle Gist embeds. Since they only consist of a single script tag it initially seemed like there wasn't a lot to go on. Not to mention that it would trigger…

Let's get straight to the point, I'm terrible at breakfast. It's always been way to easy for me to just skip it and not eat anything until lunch. Not exactly ideal. Since I'm not the least motivated to make breakfast in the morning, I decided to go for something I…