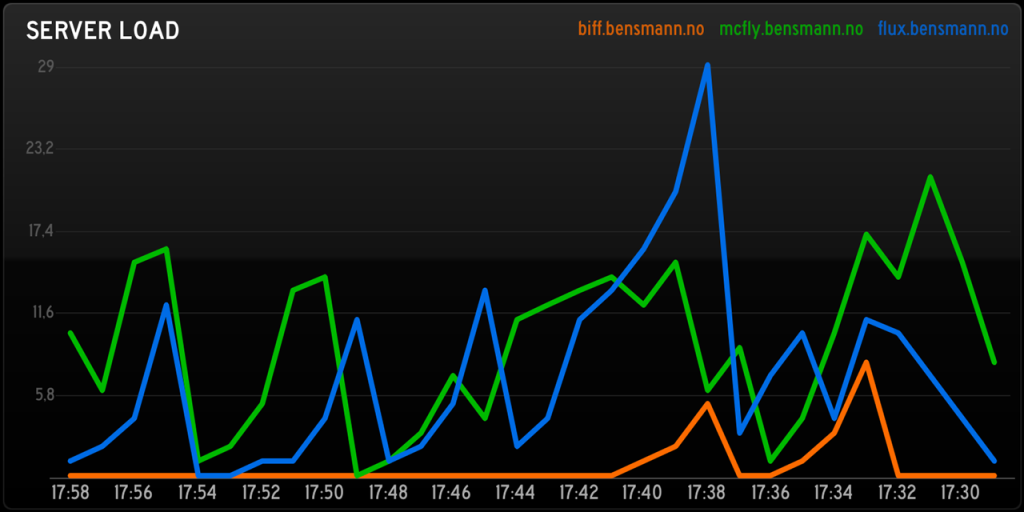
Soon after the launch of StatusBoard I published a short example of how the app could be used to display server statistics. After a lot of feedback it seems that what was of most interest to readers was what wasn’t in the post, the graph that displays historic server load …
For those who still are interested I have created a GitHub repo to share the script that allows exactly this. In short, setup and configure the script on a single server, then have all your servers call it ( using cron and curl ) in order to communicate with the script.
Here are some other posts you may like

As an outdoor enthusiast, there's nothing quite like the feeling of being nestled in a hammock or tucked away in a tent, enjoying the serenity and peace of nature. But as the sun sets and darkness envelops the landscape, a little extra illumination can make all the difference. Enter the…

In the realm of home automation, Home Assistant stands out for its flexibility and customization capabilities. A common scenario, when working with blueprints, involves using triggers based on input variables. But what if you need to modify these inputs for different triggers? This challenge led me to a solution that…

Electric power companies, in general, are pretty much the same. Tibber however, is unlike any electricity company I had seen before. They try to utilise the data we get from smart devices, which they also sell, to save electricity, money and the environment, as well as improving comfort. It’s a…