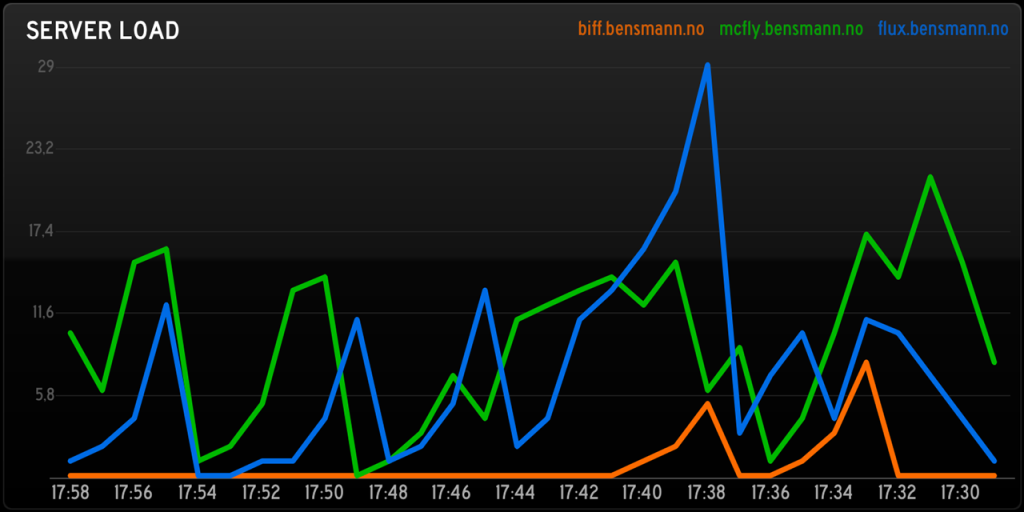
Soon after the launch of StatusBoard I published a short example of how the app could be used to display server statistics. After a lot of feedback it seems that what was of most interest to readers was what wasn’t in the post, the graph that displays historic server load …
For those who still are interested I have created a GitHub repo to share the script that allows exactly this. In short, setup and configure the script on a single server, then have all your servers call it ( using cron and curl ) in order to communicate with the script.
Here are some other posts you may like

Plenty of people today still have their reservation about buying an electric car. So, after having driven exclusively electric for the last two years, why is it that I think Teslas are awesome and wouldn't even consider going back? 1. It's a computer on wheels I came from a new…

Electric power companies, in general, are pretty much the same. Tibber however, is unlike any electricity company I had seen before. They try to utilise the data we get from smart devices, which they also sell, to save electricity, money and the environment, as well as improving comfort. It’s a…

Introduction Picture this: its freezing outside, and you're about to head out for the day. Wouldn't it be great if your car was already warmed up and ready to go? Not only that, but that it had used an appropriate amount of energy doing so? That's not just wishful thinking;…