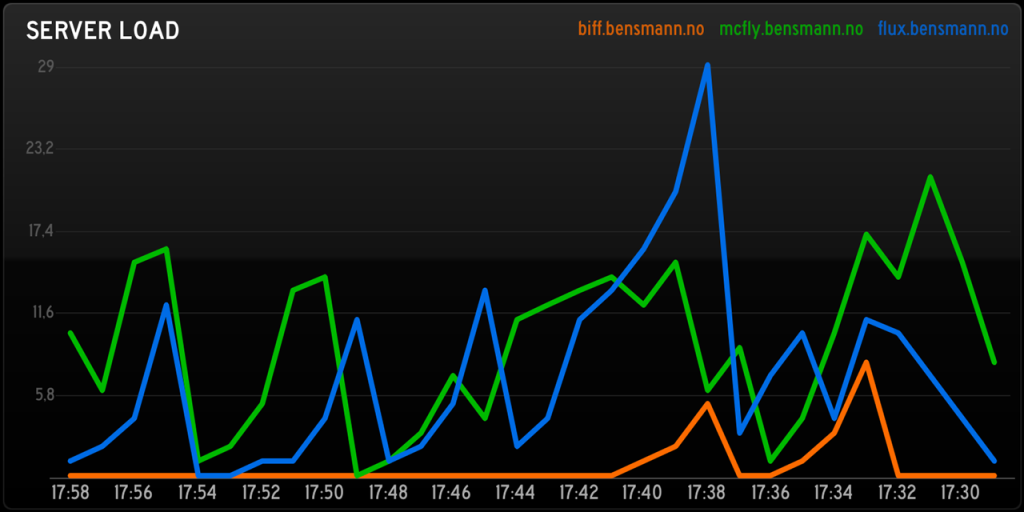
Soon after the launch of StatusBoard I published a short example of how the app could be used to display server statistics. After a lot of feedback it seems that what was of most interest to readers was what wasn’t in the post, the graph that displays historic server load …
For those who still are interested I have created a GitHub repo to share the script that allows exactly this. In short, setup and configure the script on a single server, then have all your servers call it ( using cron and curl ) in order to communicate with the script.
Here are some other posts you may like

When Sandy was about to hit New York, @jorgenb came up with a great idea. Download the images from the NY-times webcam and make a timelapse of it. A few minutes later I had a very simple script ready, and could leave my server to the task. The video I…

Electric power companies, in general, are pretty much the same. Tibber however, is unlike any electricity company I had seen before. They try to utilise the data we get from smart devices, which they also sell, to save electricity, money and the environment, as well as improving comfort. It’s a…

Smart home technology should always enhance your home and never complicate it. That's why I believe in having wall switches for essential functions, even if they're also controlled by motion sensors or other means. One of the newer option in this segment is the Tap Dial, and I'm excited to…