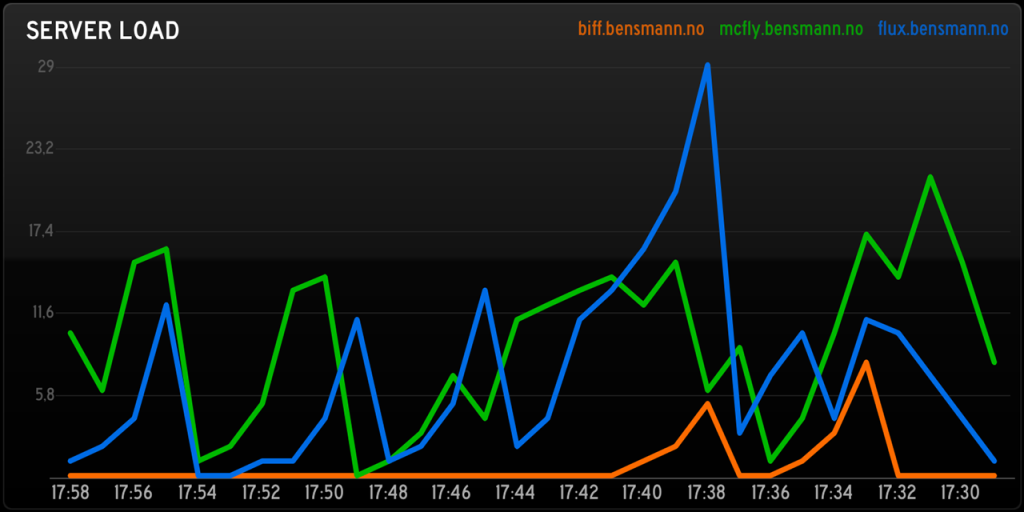
Soon after the launch of StatusBoard I published a short example of how the app could be used to display server statistics. After a lot of feedback it seems that what was of most interest to readers was what wasn’t in the post, the graph that displays historic server load …
For those who still are interested I have created a GitHub repo to share the script that allows exactly this. In short, setup and configure the script on a single server, then have all your servers call it ( using cron and curl ) in order to communicate with the script.
Here are some other posts you may like

Update: The referral program is coming to an end, Febuary 1st. To qualify for 6 months of free supercharging, use a referral code before this date at the purchase of a Tesla Model 3, S or X. https://twitter.com/elonmusk/status/1085771520058679297 Tesla certainly does things differently. One thing that really puts this into…

Electric power companies, in general, are pretty much the same. Tibber however, is unlike any electricity company I had seen before. They try to utilise the data we get from smart devices, which they also sell, to save electricity, money and the environment, as well as improving comfort. It’s a…

In today's work-from-home era, a seamless and professional video meeting setup has become an essential part of our daily routine. As remote work becomes more prevalent, it's a good idea to create a space that not only delivers excellent video quality but also integrates smart lighting and automation to create…